
The Favourite-Longshot Bias in NHL Totals
 Available in US
The first time I noticed the pattern was during the 2021-22 season, after a stretch where I’d been backing overs on what looked like obvious shootouts and losing more than I should have been. I dug into the closing-line data and the answer was already sitting in academic papers I hadn’t bothered to read. Hockey totals don’t behave like the rest of the sports betting universe. They invert the bias that shapes nearly every other market on a sportsbook’s board, and once you see it, you can’t stop seeing it.
This article is about why NHL totals are systematically mispriced in one direction, what the data actually shows, and how to bet against the grain without falling into the traps that catch people who half-understand the concept.
Table of Contents
- What Favourite-Longshot Bias Normally Looks Like
- Why Hockey Totals Flip the Pattern
- How the Bias Shows Up in Real Prices
- The Trap of Betting Unders Mechanically
- What the Data Says About Hold and Edge
- Where the Bias Doesn’t Apply
- Reading Your Own Results Honestly
- How I Use the Bias Now
- Common Questions on the Under Bias
What Favourite-Longshot Bias Normally Looks Like
Pick a horse race. Pick a Premier League match. Pick almost any major sport. Across thousands of studies, the same pattern shows up: heavy favourites are slightly underpriced and longshots are heavily overpriced, because casual bettors prefer the dream of a big payout to the grind of small wins. Bookmakers shade lines accordingly, the favourite-longshot bias becomes self-reinforcing, and sharps make a living betting against it.
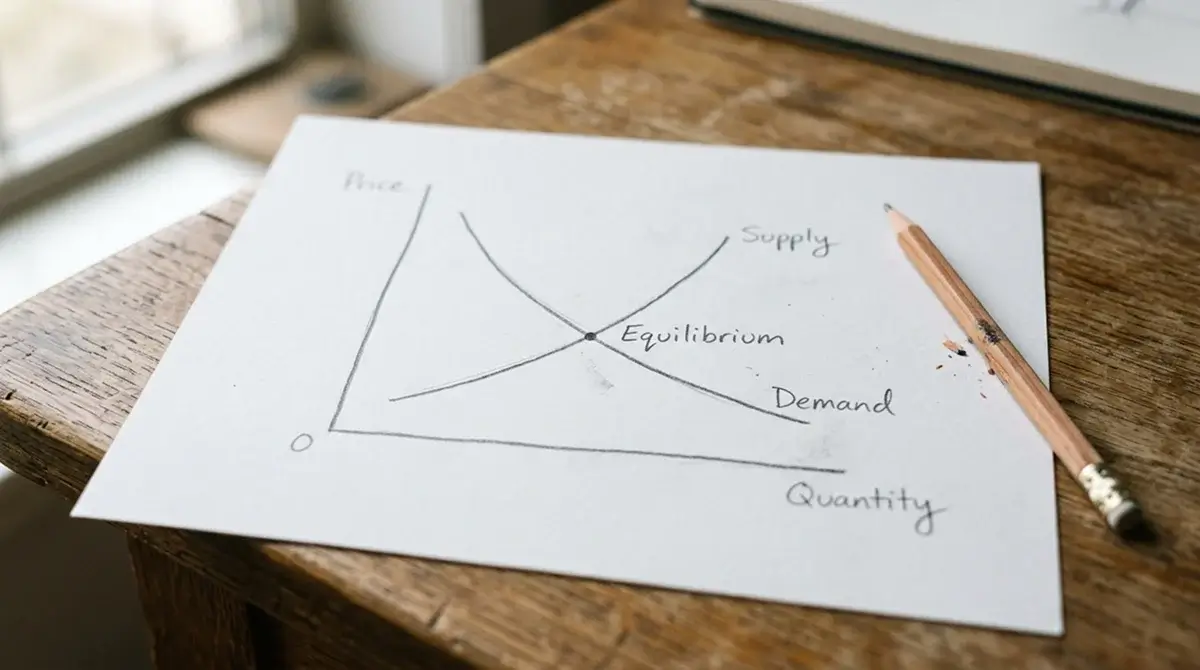
This is the textbook bias. Bet favourites, fade longshots, capture the structural mispricing. Most introductory betting books treat it as gospel because in football, racing, tennis and basketball, it more or less is.
Why Hockey Totals Flip the Pattern
Now look at NHL totals. The research that pulled me into this market — work by Woodland and Woodland published in the Journal of Sports Economics — found that NHL totals reverse the standard bias. The under is the value side, not the over. Bettors systematically overprice high-scoring outcomes and underprice low ones, and the bookmakers’ lines reflect that public preference rather than corrected for it.
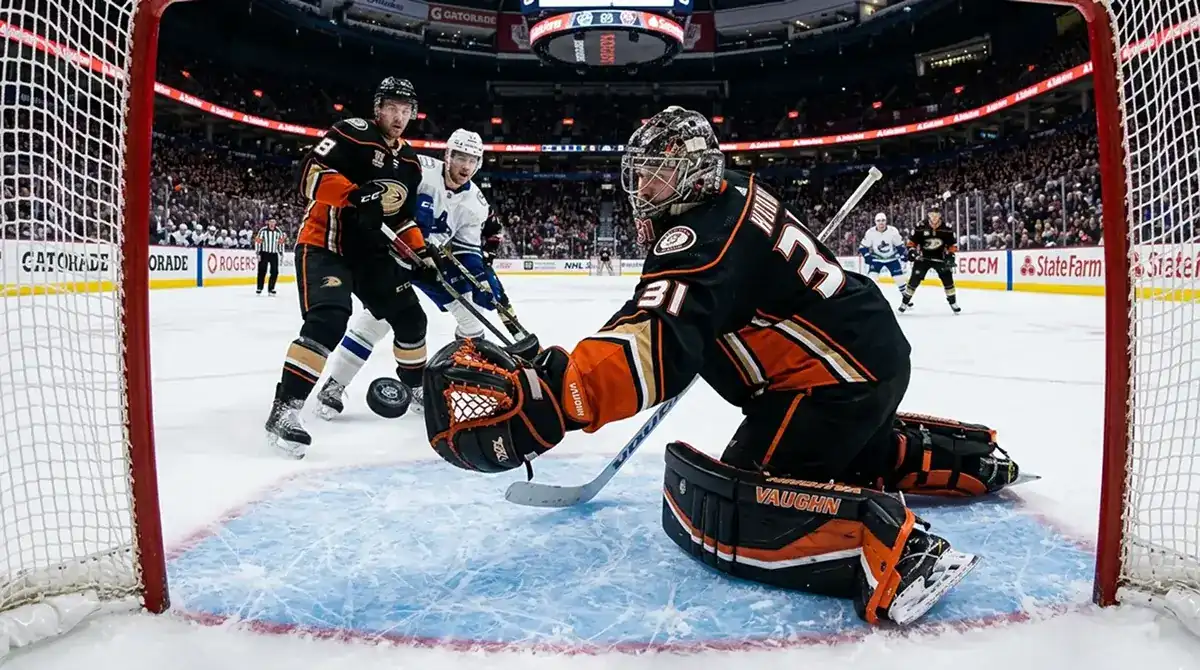
Why? Three reasons that interact. First, hockey is a sport people watch for goals. Casual punters bet the over because they want to enjoy the game, not because their model says nine goals is likelier than four. Second, goalies are the dominant variable in any given match, and the public chronically undervalues their impact — a hot goaltender can drag a 6.5 total to a 4-2 final, but the betting public is reluctant to price that in. Third, the structure of the sport rewards low-event variance: power-play droughts, slow second periods, empty-net goals that don’t actually change game flow but inflate finals.
The cumulative effect is that NHL totals lines, on average, sit a quarter to a half-goal higher than they “should” if the market were pricing efficiently. Across a full season of 1,271 regular-season games — 32 teams playing 82 each — that systematic shading produces a measurable edge for bettors willing to take the under as a baseline.
How the Bias Shows Up in Real Prices
I lost a small wager last season trying to back an over at 6.5 in a game that featured Igor Shesterkin and Connor Hellebuyck. The line had been bet up from 6 to 6.5 in the hours before puck drop, presumably because both teams had scored five the night before. The final was 3-1. That’s the bias compressed into a single result — public memory anchors on recent scoring, the line shifts to accommodate the public, the actual game features two elite goaltenders and lands well under.
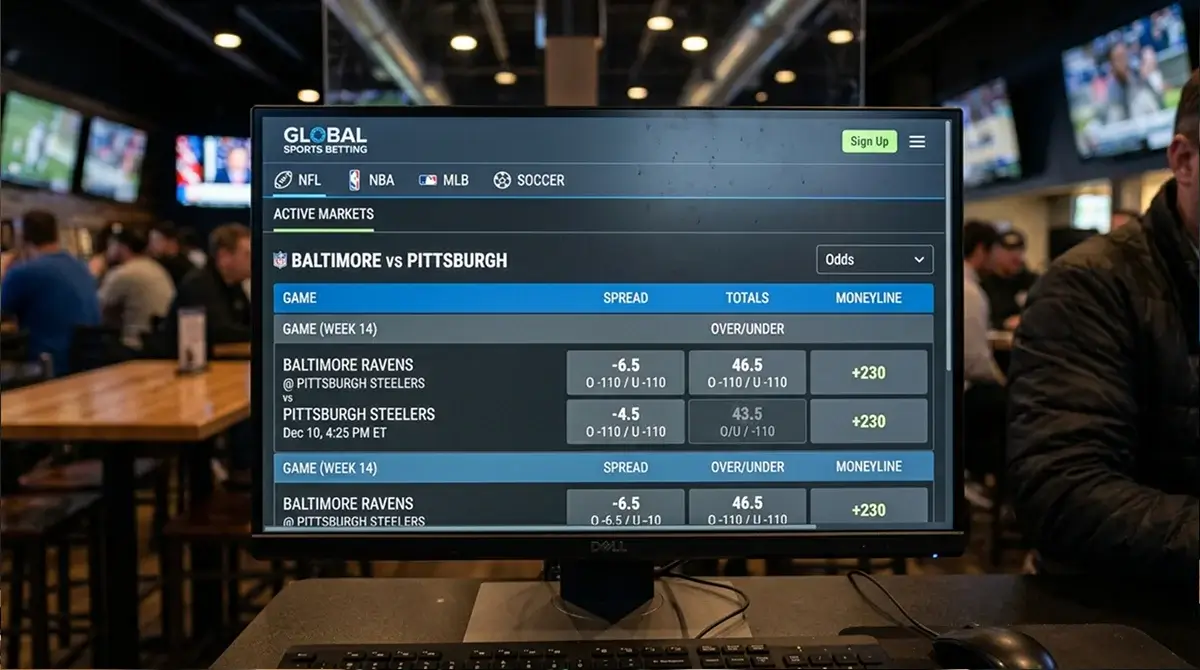
If you look at NHL totals over a meaningful sample, two patterns repeat. Games with a posted total of 6.5 or higher land under more often than the implied probability suggests. And games with star goaltenders in net for both sides tend to clear the under by more than the model would price, because casual bettors don’t adjust enough for goaltending. The market doesn’t ignore goaltenders — sportsbooks like Caesars have noted a starting goalie change moves implied probability roughly 3% to 5% — but it underprices their suppressive effect on totals.
The Trap of Betting Unders Mechanically
Here’s where people misapply the research. “NHL unders have positive expected value” becomes “always bet the under,” which becomes a flat-stakes strategy that loses money within three months because you’ve ignored the part where the edge is small, conditional, and not present in every game.

The bias is a statistical tendency, not a free pass. Three things matter when filtering which unders to actually back:
The total has to be elevated. The pricing inefficiency widens at higher numbers because that’s where public sentiment piles up. A 5.5 total carries far less under value than a 6.5 — the line is closer to the true distribution. If you’re betting unders, you’re hunting the 6.5 and 7 totals where the goal expectations have been inflated, not picking up dimes on every game.
The matchup has to support it. Two elite goaltenders is the obvious filter. Two teams that play structured, low-event hockey — heavy on neutral-zone forechecks, light on transition offence — is the next layer. Throw in second nights of back-to-backs where pace tends to drop, and you’ve narrowed the field to spots where the under is actually mispriced rather than just statistically tilted that way.
The price has to still be live. Sharp money knows this bias and bets accordingly. If you’re getting an under at -120 because the line has already moved, the edge has been arbitraged out. The bets that pay are the ones where the line hasn’t fully responded to the matchup yet, usually because public over-money is holding it up. Watching line movement is the way to spot those windows — which is also why understanding line movement in NHL betting matters for anyone using this bias seriously.
What the Data Says About Hold and Edge
Sportsbook hold on NHL totals runs slightly higher than on moneylines, typically around 4.5% to 5% versus 3.5% to 4%. That’s the cost of doing business and it’s the figure your edge has to clear to be profitable. US sportsbooks reported $165.58 billion in handle for 2025 with $16.80 billion in gross gaming revenue — a 10.15% combined hold across all sports, with in-play accounting for 60% or more of total volume. Hockey is a smaller share of that pie than football or basketball, which means lines on niche markets — third-period totals, team totals — see less sharp action and can lag longer.

The mathematical reality is that if the favourite-longshot bias on hockey totals adds two to three percent to the under’s true probability at elevated numbers, and the book is charging four to five percent in hold, you’re not making money on every under you back. You’re making money on the subset of unders where the matchup, the goaltenders, the schedule and the line price all align. That’s a much narrower set of bets than “always under,” but it’s a profitable one.
Where the Bias Doesn’t Apply
I’ve seen people lose money assuming the under-bias holds in markets it doesn’t. Playoff games behave differently — the goaltending tightens further, but the totals lines already reflect that. The lines for playoff games are sharper because the books know the public has adjusted expectations after the regular season. The window for under value narrows.

EIHL totals are an even less reliable application. The Elite Ice Hockey League produced a record 1,321,128 attendance figure across the 2024-25 season with an average of 3,863 per match across 270 games, which is a healthy domestic league but a market with thinner liquidity than the NHL. Books may shade EIHL lines for different reasons — limited public information, fewer comparable data points — so the under bias that’s statistically robust in 1,271-game NHL samples isn’t reliable in a 270-game EIHL season.
Tournament hockey — the IIHF World Championship, the Olympics, the 4 Nations Face-Off — has its own pricing logic that doesn’t necessarily follow the NHL pattern. Best-on-best tournament hockey sees defensive systems clamp down hard, but the lines also reflect that, so the public-vs-sharp mispricing isn’t as predictable.
Reading Your Own Results Honestly
The way you find out whether you’re exploiting the bias or just running hot is to track everything. Posted total, your bet, closing total, result. After 100 unders you should be able to see whether the line moved against you between when you bet and when it closed. If it did, you’re getting good prices. If it didn’t, you’re either timing badly or the edge isn’t there in your sample.

This is the unglamorous part — closing line value is the metric that doesn’t lie to you. Win rate over 50 bets means almost nothing in hockey totals because variance is wide enough to produce 30-20 records by luck alone. CLV across 200 bets tells you whether the market agrees with your selections. If it does, hold your stakes. If it doesn’t, the strategy needs work, not more conviction.
How I Use the Bias Now
After enough seasons of testing, I treat the favourite-longshot inversion on NHL totals the way I’d treat any structural market feature: as a starting point, not a system. It tells me which side I should be looking at first when a high total is posted and the matchup is favourable. It doesn’t tell me to bet every game. The edge is real, but it lives in the intersection of pricing, matchup and timing, and it punishes anyone who treats it as a green light to fire blindly.
Knowing the bias exists puts you ahead of about ninety percent of recreational bettors who default to overs because hockey is a fun, fast game and they want to be on the side of goals. Acting on it carefully — picking your spots, watching the line, accepting that some unders will land at 7-6 and not chasing — is what separates the people who profit from the research from the people who just quote it.
Common Questions on the Under Bias
Is it true that NHL unders are always profitable?
No. The bias creates a small statistical edge on elevated totals with the right matchup conditions, but mechanically betting every under loses money once sportsbook hold is factored in. Selectivity matters more than direction.
Why do casual bettors favour the over in hockey?
Watching for goals is the default reason people follow hockey, so backing the over feels aligned with the experience. That public preference shades totals lines higher than the actual goal distribution justifies, creating under value at the margins.
Does the bias hold in playoffs or international tournaments?
Less reliably. Playoff totals are priced more sharply because both books and public adjust expectations. Tournament hockey follows its own pricing logic, so the regular-season NHL pattern shouldn’t be assumed elsewhere.
Published by the ice Hockey Betting team.