Ice Hockey Betting Strategy and Analytics
 Available in US
Table of Contents
- The Quiet Discipline Hockey Demands
- Variance and Edge: The Two Forces You Are Always Balancing
- The Pre-Bet Research Workflow
- Goaltender Impact: The Single Most Important Factor
- Schedule and Fatigue Factors
- Advanced Metrics Worth Tracking
- Line Shopping and Reading Line Movement
- Value Betting: What It Actually Means
- Bankroll and Stake Sizing
- Common Pitfalls Even Careful Bettors Run Into
- Doing the Quiet Work Across a Full Season
- Common Questions on Hockey Betting Strategy
The Quiet Discipline Hockey Demands
The NHL handicapper Kyle Kargel once wrote that “winning in hockey requires more than just knowing who’s hot or who won their last game. The NHL is a high-variance league where small edges, timing, and context often matter more than raw talent.” That paragraph captures something I have been trying to articulate for nine years. Hockey punishes lazy bettors faster than most other markets, and the punishment is rarely dramatic enough to feel like one. You do not lose your bankroll in a weekend. You drip out three to five per cent a month until you stop counting.
The thing about hockey strategy is that the headline ideas are not the difficult part. Everyone knows you should shop lines, follow goalie news and avoid steaming favourites. The difficult part is doing those things consistently across a 1,271-game NHL season plus EIHL plus the international calendar, when every other UK punter you know is happy to back gut feel on a Sunday night. Discipline beats insight in hockey over any meaningful sample, and it does so quietly.
This guide is built around the routines that actually move my long-term numbers, not the routines that look impressive in a strategy article. Variance and edge, the research workflow, the goaltender layer, schedule and fatigue, the advanced metrics that matter and the ones that do not, line shopping and line movement, value betting, bankroll and the pitfalls that catch even careful bettors. I will tell you what I do and why, with the caveat that any single bettor’s workflow needs to be adapted to their own preferences and risk tolerance.
Variance and Edge: The Two Forces You Are Always Balancing
The first thing a serious hockey bettor needs to internalise is how high the variance actually is. NHL games are decided by one or two goals far more often than fans of other sports realise — roughly seventy per cent of regulation results sit within a two-goal margin. That tight margin is what makes the puck line interesting, and it is also what makes individual hockey bets emotionally volatile. You can have a clear analytical edge on a matchup and still lose for reasons that have nothing to do with your model.
The Woodland market efficiency studies on hockey totals identified a structural pricing inefficiency that has lasted across decades: a reverse favourite-longshot bias where bets on the underdog outcome in totals markets (the under in low-scoring sports like hockey) systematically returned higher than market-efficiency hypotheses predicted. The persistence of that bias across multiple decades is the underlying reason patient, model-driven hockey bettors can still beat the closing line over a meaningful sample. The market is not perfectly efficient, even on the most heavily bet games.
The strategic implication is that hockey betting is fundamentally a long-game discipline. Any single bet, any single week, even any single month can produce results that are nearly indistinguishable from random across reasonable stakes. The bettors who survive treat their results as something to measure across a season or longer, not across a weekend.
That has practical consequences for staking. If you cannot psychologically stomach a six-week losing run on bets you are confident about, hockey is going to be hard work. The discipline is not just analytical — it is emotional. The bettors I know who have lasted longest are the ones who set expectations correctly at the start. A two to four per cent return on turnover across a full season is a strong result for a hockey bettor, and even getting there requires keeping enough discipline to survive the variance windows that come with the territory.

The Pre-Bet Research Workflow
My research workflow on a typical NHL game has not changed in seven years. The volume of games is high enough — there are 1,271 NHL regular-season fixtures across the calendar plus the EIHL schedule on top — that you cannot afford to spend forty-five minutes per game. The trick is to have a routine that handles ninety per cent of the inputs in about ten minutes, and to know which games deserve the extra thirty-five.
The routine starts with the goaltender confirmation. Morning skates in the NHL typically conclude between fifteen-thirty and eighteen-thirty UK time, and the starting goalie news flows out through reporters’ Twitter accounts and the major hockey-news sites in the hour afterwards. Until I know who is starting in net, I do not look at the line, because everything downstream of that question changes.
Second is the recent performance window. Last five games for each team, with attention to whether the wins were against quality opposition or against bottom-third sides. A team on a five-game winning streak against the league’s lowest scorers is not the same team that has gone 3-2 against playoff contenders.
Third is the schedule context. Is either team on a back-to-back, on the second leg of a road trip, or coming off a long flight across time zones? Schedule context tends to be the most underpriced factor in mid-week NHL games, particularly the West-to-East flight effect.
Fourth is the underlying metrics. I check expected-goals differential and shot-attempt share at five-on-five for both teams across the season to date. The numbers are not magic, but they catch the gap between a team’s actual results and its underlying play, which often tells you where the line is mispriced.
Fifth is the special-teams matchup. Power-play percentage versus penalty-kill percentage on both sides. A top-five PP against a bottom-five PK can shift expected scoring by half a goal on a game where penalty volume is normal.
Sixth is the line itself. By the time I look at the line, I have already formed a view about what fair pricing should be. The line tells me whether the books agree, whether they disagree, and whether the disagreement is large enough to bet into. If my fair line is within two cents of the book’s price, I usually pass and move on. If the gap is wider than four cents and I cannot identify a reason the book might know something I do not, I make the bet.

Goaltender Impact: The Single Most Important Factor
The goaltender layer deserves its own section because it sits underneath every other piece of hockey analysis. Karry Shreeve at Caesars Sportsbook has put the upper bound of the goalie’s pricing effect plainly: “Most of the time I’d say that a goalie, at most, is worth three to five per cent of implied probability.” That three-to-five-per-cent band is the structural ceiling for how much a goaltender swap can move a line, and it tells you why goalie news is the highest-leverage information in hockey betting.
The reason the ceiling sits at three to five per cent is mathematical. NHL goaltenders cluster within a relatively narrow performance band. The gap between an average starter at .905 save percentage and a top-five starter at .920 is fifteen save-percentage points across roughly thirty shots per game, which works out to about half a goal of difference per game. Half a goal moves the moneyline by a meaningful amount but not by an overwhelming amount. The exception is when a known backup who has played less than ten games faces a top-line offence — that is a different calculation, and the implied-probability swing can be sharper.
The practical betting workflow on goaltenders has three pieces. First, monitor confirmed starters obsessively. The morning skate window between fifteen-thirty and eighteen-thirty UK time is when most of the day’s actionable goalie news arrives. Lock prices on goalie-driven lines before the news fully diffuses through the books, because the prices will tighten once it does.
Second, weight the matchup. A starter facing a high-volume shot team is not the same bet as the same starter facing a low-volume shot team. The goalie’s quality matters more when they face more shots, which is a structural reason why high-totals games carry more goalie-pricing leverage than low-totals games.
Third, factor in the backup risk. If the projected starter has played heavy minutes in recent games and the schedule shows a back-to-back, there is meaningful probability of a tandem-split start where the backup takes the game. Pre-confirmation prices on those games tend to lean toward the projected starter, which produces value in the moneyline if the backup ends up taking the start.

Schedule and Fatigue Factors
The schedule is the second-most-important factor after goaltending, and it is also the one most consistently underused by recreational bettors. NHL teams play eighty-two games across roughly twenty-six weeks, which means they average just over three games per week — but the distribution is not even. Back-to-backs concentrate certain weeks, road trips concentrate others, and the cumulative fatigue effect shows up in the data in predictable ways.
Back-to-backs are the headline schedule factor. NHL teams playing the second game of a back-to-back perform meaningfully worse than their season averages, particularly when the second game is on the road. The implied effect on the moneyline is typically two to four cents, which is in the same band as a goalie swap. The books price this partially but rarely fully, especially on small-market matchups.
Travel direction matters next. East-to-West flights through multiple time zones produce measurable performance drops, particularly on the same-day arrival cases that the modern NHL schedule sometimes produces. A team flying from Boston to Vancouver and playing the same night carries a real fatigue cost that the books are slow to price.
The third travel factor is the cumulative road trip. Teams in the middle of a five-game road swing perform worse in the latter games than in the earlier ones, with the effect compounding when the trip crosses time zones. Knowing where a team is on its road trip is a small but real input into pre-match pricing.
For EIHL bettors, the travel calculus is different but still meaningful. Belfast Giants flying to mainland fixtures, Cardiff making the Welsh-Wales-and-back trips, and any club playing back-to-back weekend games all produce real fatigue effects that the smaller European-facing books often price even less precisely than they price NHL fatigue. The EIHL travel discipline is also worth carrying through to the bigger UK books that price EIHL games infrequently.
One under-discussed schedule factor is the post-bye-week effect. NHL teams return from their five-day mandatory bye week in slightly worse form than their season averages would predict, with the effect lasting for the first two or three games after the bye. The pattern has been documented enough that it shows up in betting data, but the books still tend to over-price the recently-bye’d side.

Advanced Metrics Worth Tracking
The conversation around hockey analytics has matured enough that several advanced metrics have moved from experimental to established. Expected goals (xG), shot-attempt share (Corsi), unblocked shot-attempt share (Fenwick) and goals-saved-above-expected (GSAx) all show up in modern hockey-betting workflows. Knowing which of these to weight and which to mostly ignore is one of the bigger skill gaps between casual and serious bettors.
Expected goals is the most useful single metric for matchup-level analysis. It captures shot quality (location, type of shot, situation) rather than just shot quantity, and it tends to predict future scoring better than current goal differentials do. A team outperforming its expected-goals differential at five-on-five is a regression candidate; a team underperforming is typically due to a positive correction.
Corsi and Fenwick share — measuring shot-attempt control at five-on-five — are useful as supporting metrics but should not be the primary lens. They are particularly useful for separating teams that are getting lucky from teams that are genuinely controlling play.
PDO — the sum of a team’s shooting percentage and save percentage — is a regression indicator more than a performance metric. A team with a PDO above 102 at the five-on-five level is over-running its true performance and likely to drop back; a team below 98 is under-running and likely to recover.
Sample size is where most advanced-metrics analysis goes wrong. Save percentage is the obvious example — an individual NHL goaltender’s save percentage stabilises only after roughly 1,500 to 2,000 shots faced. Below that threshold, the numbers carry too much variance to be a reliable signal. Other metrics have their own stabilisation thresholds, and bettors who use small samples as if they were stable signals end up systematically misreading the data. The deeper mechanics of save percentage stabilisation — the exact thresholds, how to weight high-danger versus overall save percentage, and the practical workflow for using goaltender data without overfitting — sit in our companion guide to save percentage sample size.
The practical workflow is to use advanced metrics as a sanity check rather than as a primary input. The line and the schedule and the goalie news are your primary inputs. The metrics tell you whether your read of the matchup is internally consistent with the underlying play. When the line agrees with the metrics, you have less reason to bet; when the line disagrees with the metrics in a direction your other inputs support, you have more reason to.

Line Shopping and Reading Line Movement
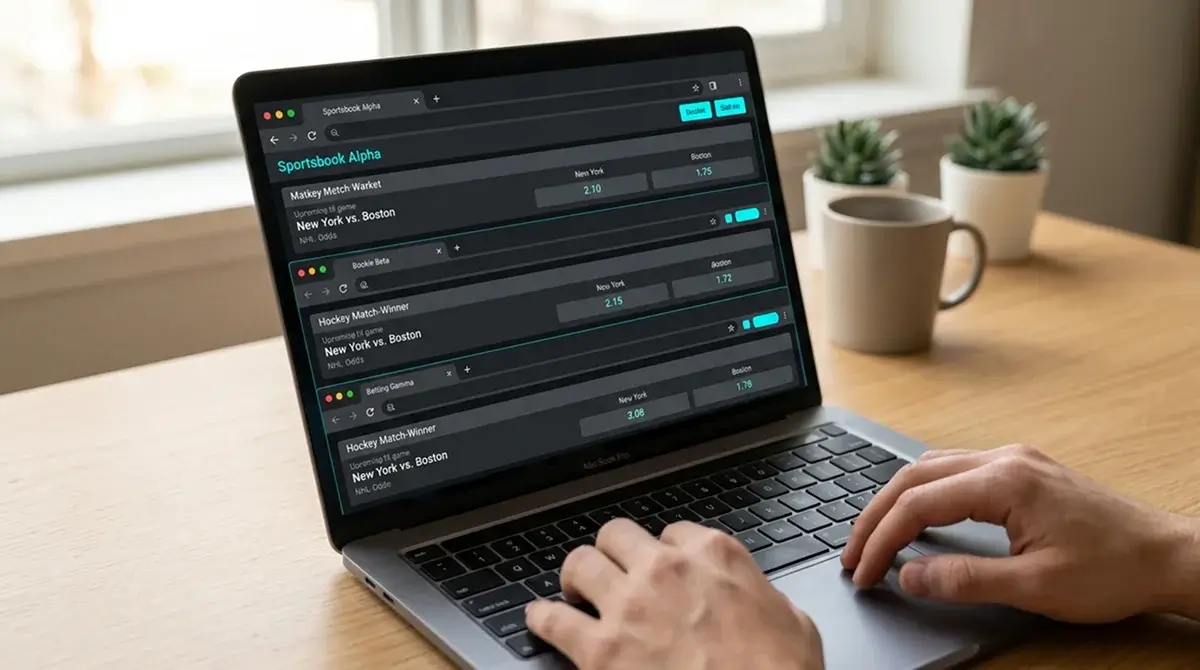
Line shopping is the lowest-skill, highest-leverage activity in hockey betting. Every UK bettor I know who has profited over multi-year stretches maintains accounts at three or four UK books and checks all of them before placing any meaningful stake. The reason is structural: the same NHL moneyline can vary by three or four cents across two UK books on any given Tuesday night, and over a season those cents compound into a sizeable percentage of total return.
The discipline is to check two or three books for every market you actually bet. Moneyline, puck line and totals are non-negotiable. Anytime goalscorer and other props have wider price variance — sometimes twenty per cent on a mid-tier player — and the shopping rule applies more strongly there.
Reading line movement is the related skill. Lines move for three reasons: news, sharp money and casual money. News (an injury, a goalie change, a coach announcement) moves the line in one direction across multiple books simultaneously. Sharp money also moves multiple books, but on a delay — the first book to take the action moves first, then the others follow within an hour or two. Casual money tends to move a single book that has taken disproportionate volume, often without parallel movement at other books.
The strategic reading is that the directional signal in line movement matters, but the cross-book consistency matters more. A line that moves at one book but not at others is probably just that book’s exposure correcting. A line that moves consistently across the major UK and US books is probably either news or sharp action, and the side the line is moving against is the side that has been taking real money.
Closing-line value (CLV) is the longest-term discipline derived from line shopping. The idea is simple: if you consistently bet at prices longer than the closing line, you are betting into a market that thinks your bet is more valuable than the price you got. CLV does not guarantee profitability — short-term variance can override it — but a positive CLV record across hundreds of bets is the single best leading indicator of long-term profit.
Value Betting: What It Actually Means
The phrase “value betting” gets thrown around in every gambling guide ever written, and it usually means nothing. Value betting in any meaningful sense is the discipline of finding bets where your fair-line estimate exceeds the book’s offered price by a margin large enough to overcome the book’s hold. Done right, it is a sustainable approach. Done wrong, it is a slow way to convince yourself that random outcomes are skill.
The mechanical foundation is the no-vig fair price. If a two-way moneyline is priced at 1.65/2.30, the implied probabilities are 60.6 per cent and 43.5 per cent, summing to 104.1 per cent. The four per cent above 100 is the book’s hold. The no-vig fair price is what those same implied probabilities would look like if you re-normalised them to sum to exactly 100 per cent. In this case, Edmonton’s fair implied probability is 58.2 per cent (equivalent to 1.72 in decimal), and Vancouver’s fair implied probability is 41.8 per cent (equivalent to 2.39).
Value betting means finding cases where your own model — derived from the research workflow I described earlier — gives you implied probabilities meaningfully different from the no-vig fair price. If your model gives Edmonton 53 per cent and the no-vig fair price gives them 58.2 per cent, then there is value on Vancouver. If your model agrees with the no-vig fair price within one or two percentage points, there is no clear value either direction and the bet should not be placed.
The pitfall is overconfidence in your own model. The market is composed of professionals who do this for a living and have spent decades doing it, and your model is competing with their pricing. The right level of confidence in any single value bet is modest: you are not seeing a thirty per cent edge, you are seeing a one or two per cent edge if you are seeing edge at all, and the appropriate stake should reflect that humility.
The bettors I know who have made value betting work over multi-year stretches share two habits. They have a documented model that produces consistent fair-line estimates rather than gut feel. And they track CLV across every bet so they can tell whether their model is actually beating the market or just getting lucky.
Bankroll and Stake Sizing
Stake sizing in hockey betting is where most bettors blow themselves up. The variance in hockey results is high enough that even sound analytical work produces losing weeks regularly, and stake sizing that does not reflect this reality leads to drawdowns that exit the bettor from the market.
The most common stake-sizing approach is flat units. One unit equals one to two per cent of your bankroll, and every bet is one unit regardless of the perceived edge. Flat units are emotionally easier to follow during losing runs because the size of each bet does not change with your confidence, and they avoid the trap of staking up after losses.
The mathematical alternative is fractional Kelly. Kelly criterion staking sizes each bet based on the perceived edge — bigger bets on bigger edges, smaller bets on marginal ones — and fractional Kelly (half-Kelly or quarter-Kelly) damps the volatility by staking less than the full Kelly amount. Fractional Kelly is mathematically optimal for bettors with reliable edge estimates, but the catch is in the words “reliable edge estimates”: most bettors overestimate their edges, and full or even half-Kelly staking based on inflated edge estimates is a fast route to bankroll destruction.
For UK bettors building a hockey workflow, the right starting point is usually a one-per-cent unit size on flat staking for the first season. After a hundred or two hundred logged bets with documented CLV results, you can revisit whether to move to fractional Kelly with a documented edge estimate. The discipline is to err on the side of smaller stakes rather than larger ones.
Bankroll management also covers what does not go into your hockey bankroll. The money you bet should be money you can afford to lose entirely without affecting your finances. This is the discipline that connects bankroll management to the broader UK responsible-gambling framework — deposit limits, time-out tools, and self-exclusion through schemes like GAMSTOP exist precisely so that the betting bankroll stays separate from the rest of your life.

Common Pitfalls Even Careful Bettors Run Into
Nine years of watching UK hockey bettors come and go has given me a fairly clear catalogue of the mistakes that systematically end careers. They are not the spectacular blow-ups that gambling memoirs are made of. They are the small, repeated errors that drain returns over six-month and twelve-month windows.
The first is chasing losses. After a bad week, the temptation is to stake up or to add bets you would not normally take, with the unconscious goal of getting back to even. This almost never works. The variance in hockey makes a bad week feel like a problem with your process even when your process is fine, and the response should be the same when you are down as when you are up: the same unit size, the same selection criteria, the same patience.
The second is recency bias. A team that lost 5-1 on Tuesday looks worse than its season-long numbers say it is. A goaltender who had a bad game looks worse than his career save percentage. The market sometimes prices these games at a discount, and that discount can be value — but only if you can read past the recency narrative to the underlying play.
The third is over-betting flagship games. Saturday night Toronto-Montreal carries more attention than Tuesday night Anaheim-Arizona, but it also carries tighter juice, more public money and less line softness. The bettors I know who have profited tend to bet midweek games at higher volume than weekend games, because the books leave more on the table when the public is paying less attention.
The fourth is parlay drift. The maths on accumulators is unforgiving, and yet UK bettors who would never bet a single moneyline at +12 per cent juice will happily bet a four-leg accumulator with hold compounding to thirty per cent or more. Treat accumulators as recreation, not as a sustainable edge source, unless you have specifically modelled the correlation and the book’s adjustment.
The fifth is ignoring closing-line value. CLV is the single best leading indicator of long-term hockey betting profitability, and tracking it requires nothing beyond logging the closing line for every bet you place. Bettors who skip this step have no way to know whether their results are skill or variance until the variance overrides any reasonable interpretation.
Doing the Quiet Work Across a Full Season
The hockey bettors I know who have profited across multi-year stretches all share a basic profile. They bet smaller than they could afford to, they shop two or three books on every meaningful bet, they keep a written log with closing-line value, they read goalie news obsessively in the late-afternoon UK window, and they treat each season as a single project rather than as a string of disconnected weekends. None of those habits is hard. All of them are boring. The discipline is doing all of them, consistently, across the eight-month NHL season plus the parallel EIHL and international calendars. That quiet, repeated discipline is what separates the bettors who stay in the market from the ones who churn out within twelve months. The strategy advice in this guide will only work if you do the work.
Common Questions on Hockey Betting Strategy
The strategy questions UK hockey bettors ask cluster around five or six recurring themes. These are the answers I give most often when the question comes up.
Which advanced metric — xG, Corsi or PDO — most reliably signals NHL regression in November?
PDO is the most reliable mean-reversion signal across the league because shooting percentage and save percentage both regress to their long-run averages on roughly the same timeframe. A team with a PDO of 103 or higher across the first twenty games is almost always running hot in both directions simultaneously, which is unsustainable. Expected goals differential is the better metric for assessing actual underlying quality, but PDO is the cleaner regression signal. Corsi is useful as supporting context rather than as a primary regression marker.
What sample size is needed for a Corsi-based betting model to stabilise?
Corsi (shot-attempt share) at the team level at five-on-five stabilises faster than goal-based metrics because the underlying event count per game is higher. Most analysts treat thirty to forty games of five-on-five Corsi as sufficient for team-level signal, with smaller samples carrying noticeable noise. Individual player Corsi takes longer to stabilise because the per-player event count is lower and lineup deployment introduces additional variance.
How should a UK bettor weight North-American versus European travel fatigue?
North-American travel fatigue is mostly about time zones and back-to-backs, and the effect typically shows up in the day-of-game performance rather than carrying across multiple games. European travel in the SHL, Liiga and DEL is shorter in absolute terms but tighter in scheduling, and back-to-back European games on the road carry comparable fatigue effects despite the shorter flights. EIHL travel is concentrated on weekends, and the back-to-back Saturday-Sunday pattern produces real fatigue that the smaller European-facing books often price imprecisely.
Does line movement always indicate sharp action in hockey markets?
Not always. Line movement that appears consistently across multiple major UK and US books on the same direction is usually either news (an injury, a goalie change) or sharp action. Line movement at a single book that does not appear at others is typically that book’s exposure correcting, not a signal worth following. The directional signal in cross-book line movement matters, but the consistency of the movement across books matters more than the size of the move at any one book.
Published by the ice Hockey Betting team.