Ice Hockey Player Props: Goalscorers, SOG and Saves
 Available in US
Where the casual money lives
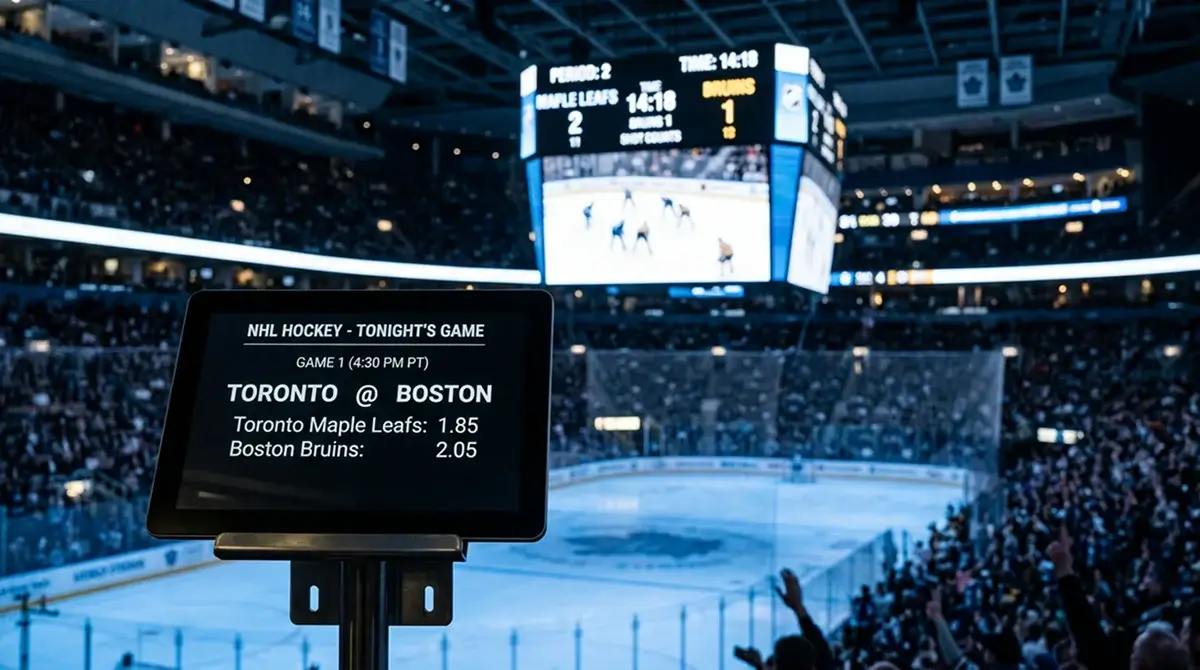
If you ever wonder why your favourite UK sportsbook plasters anytime goalscorer banners across the homepage on NHL Saturday, the answer is volume. Props are where casual money pours in. Headshots of stars, a line that says “9.00 to score” and a tap-to-bet button is a formula that prints stake counts. It also creates some of the widest pricing inefficiency in the sport.
Props have been a steady source of edge for me across nine years of NHL coverage, but they reward a different mindset to standard match betting. Instead of asking “who wins?” you ask “what does usage look like tonight?” Power-play time, line combinations, opposing goaltender, recent shooting variance — these are the inputs that move prop prices, and they are the inputs the public reliably underweights.
This guide breaks down the main prop categories UK punters see on NHL boards: anytime goalscorer, shots on goal, goaltender saves and the multi-leg parlay structures that bundle them together. We will also cover where prop prices vary most between UK books and why that variance is your friend.
The prop categories that actually exist
UK books offer a familiar set of NHL props that you will see across virtually every operator. Anytime goalscorer is the flagship — pick a skater to score at least one goal at some point in the game. First goalscorer adds tighter timing and shorter odds. Last goalscorer is the same with a different cut-off.
Shots on goal props put a numeric line on a player’s shooting volume — typically over/under 2.5, 3.5 or 4.5 shots depending on the player’s usage profile. Goaltender props focus on saves (over/under 25.5, 27.5, 30.5 depending on opposing offence) and shutout markets where you back a clean sheet at long odds.
Beyond these, books offer points props (combined goals plus assists), assist props for elite playmakers, blocked shots props for defencemen, and the occasional faceoff wins prop for centres. The deeper into the prop tree you go, the wider the juice and the thinner the volume — which means the inefficiency rises, but so does the noise.
Anytime goalscorer is harder than it looks
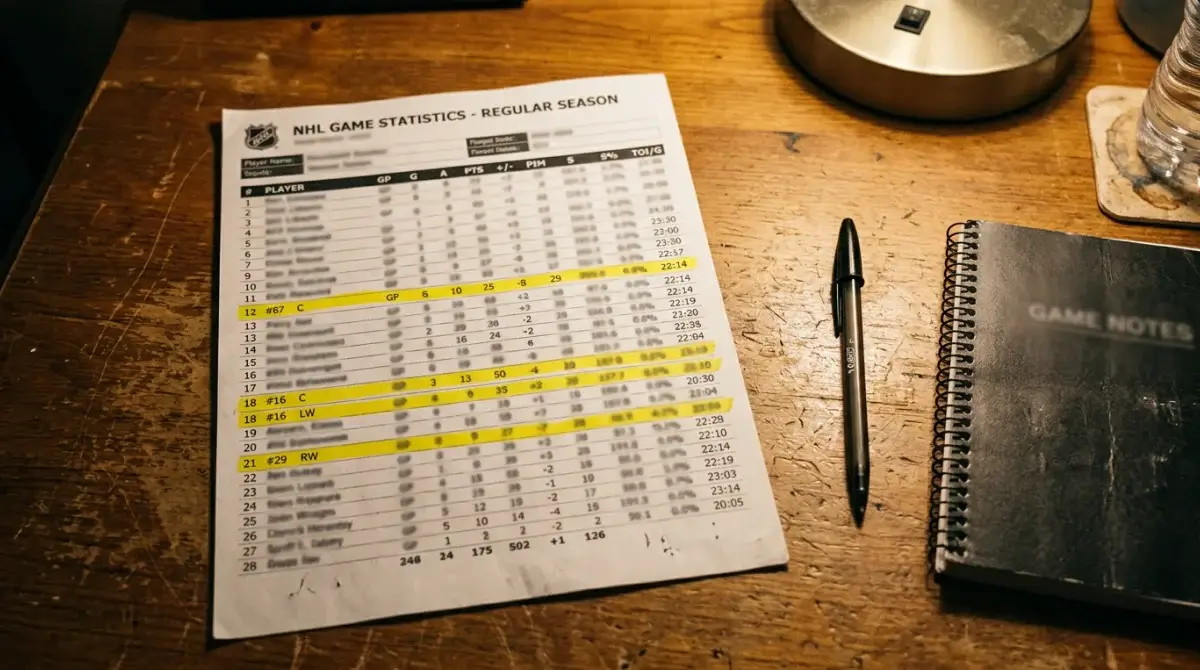
The anytime goalscorer market punishes lazy thinking faster than any other prop. A 9.00 underdog scorer looks like value until you check the data: bottom-six forwards on a struggling team produce roughly one goal every six to eight games. The fair price is 7.00-8.00 in decimal, and the 9.00 quote includes a chunky juice cushion that eats the entire margin.
The right approach is the inverse of what most UK punters do. Instead of hunting longshots, hunt mispriced favourites. A top-line forward with confirmed power-play deployment against a backup goaltender should price around 2.50-2.80 — find a book listing them at 3.10 or longer and you have a genuine edge. The 18-24 age bracket of UK punters skews heavily toward longshot prop chasing (consistent with the broader pattern that 21.9% of that age group sit in the PGSI 1+ band — the highest of any UK demographic) and books exploit that with juiced longshot prices.
Price variance between UK books on the same player is enormous. A name might be 3.20 at one operator and 4.00 at another for the same game with no news in between. Books use different base models, weight different inputs, and adjust at different speeds. Comparing two or three prop boards before placing a ticket is the single highest-value habit in this market.
Shots on goal props and ice time
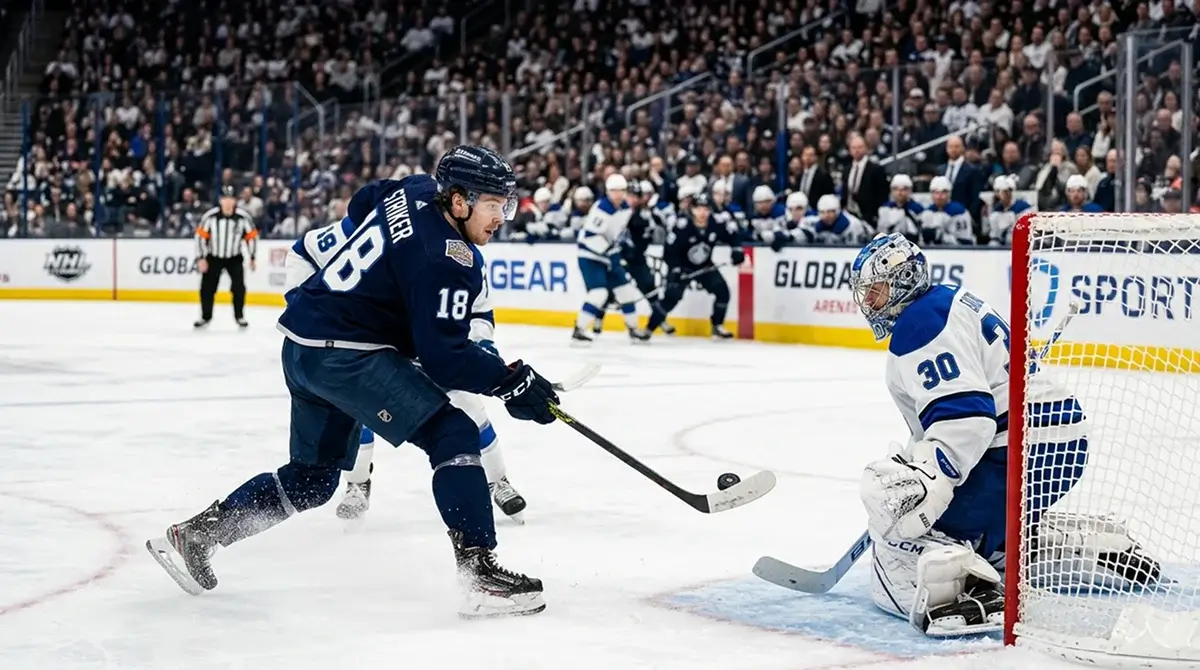
Shots on goal is the prop where I have the most consistent record, because the underlying driver is simple: ice time and shot tendency. A player who averages 19 minutes a night with a high shot rate is a different animal from a player who averages 14 minutes regardless of how many goals they have scored recently.
The public chases hot scorers on SOG props. A forward on a three-game goal streak attracts overs at every reasonable line. What the public misses is that goal streaks often correlate with shooting percentage variance, not with shot volume increase. The same player taking the same shots will see the SOG line shift upward by half a shot as the book defends the over — which is the moment the under becomes the better bet.
Power-play time on ice is the single biggest input I track. A player who runs a top power-play unit gets an extra 3-4 minutes per game in high-shot situations. If that deployment is confirmed and the SOG line has not yet adjusted, the over is worth the price. If the player has been demoted to the second unit and the line still reflects top-unit usage, the under is the bet.
Goaltender saves: the cleanest prop
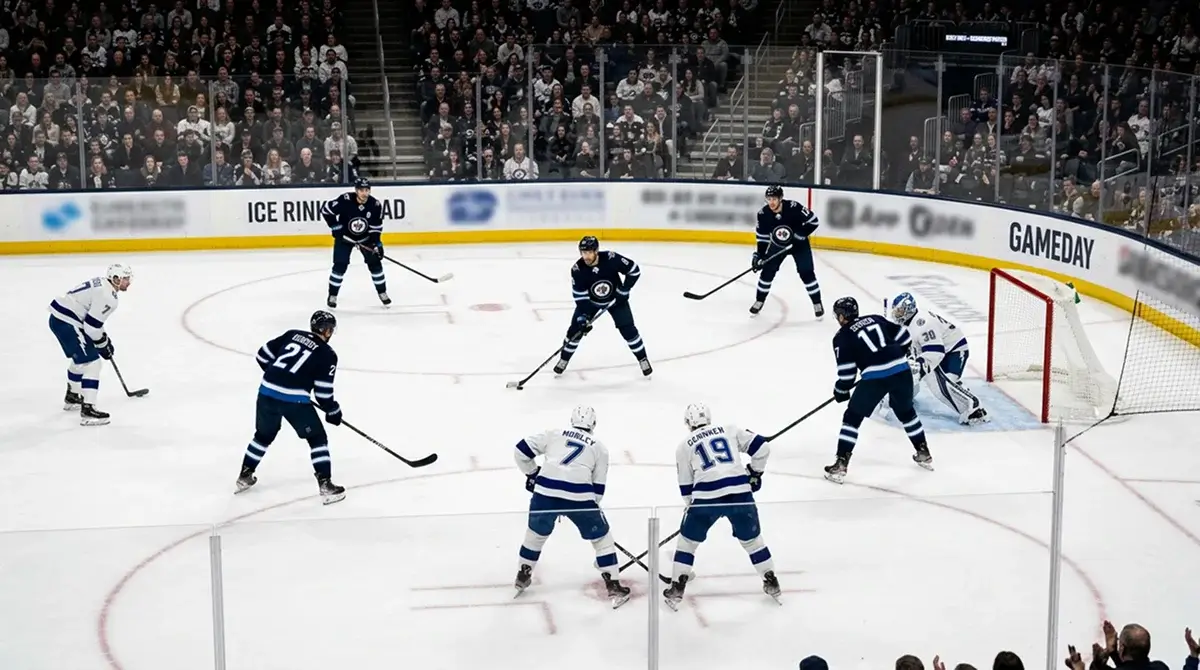
Of every prop market on the NHL board, goaltender saves is the one I think gives UK punters the cleanest read on what the book really thinks. The saves line is essentially a derived total — it tells you the book’s projected shot volume against the goaltender, with the implicit assumption of league-average save percentage.
Karry Shreeve at Caesars Sportsbook quoted the 3-5% implied probability shift from a goaltender change in the context of moneyline pricing, but the same logic applies in the opposite direction on saves props. A confirmed top-tier starter facing a high-shot offence has a saves line that reflects expected shot volume. Replace the starter with a backup and the line should shift upward by 2-4 saves — because the book expects the backup to face the same shot volume but to be less efficient at stopping them.
Of course, the over/under on saves does not care about save percentage directly — it counts saves. Higher save percentage with the same shot volume produces lower saves total. Lower save percentage with the same shot volume produces higher saves total. That asymmetry is where the prop becomes interesting: backing the over on a backup goalie’s saves prop is a backdoor way to express a “more shots on goal” thesis. For the deeper read on Sv% stabilisation and sample size, see the save percentage sample size guide.
Multi-leg prop parlays
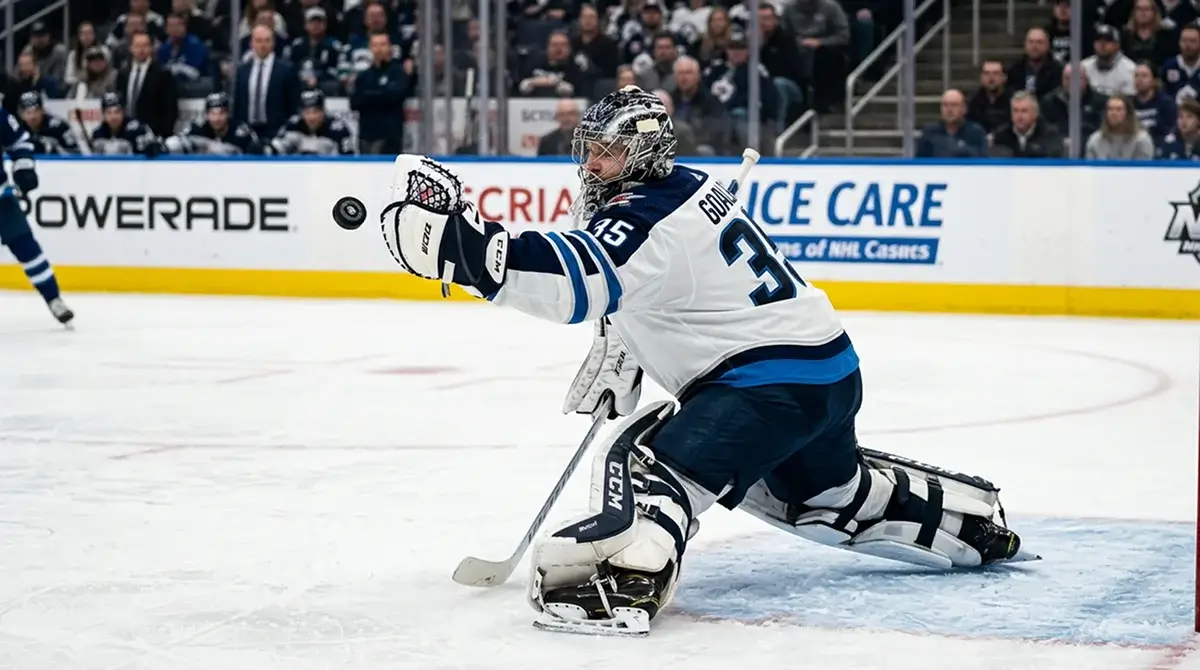
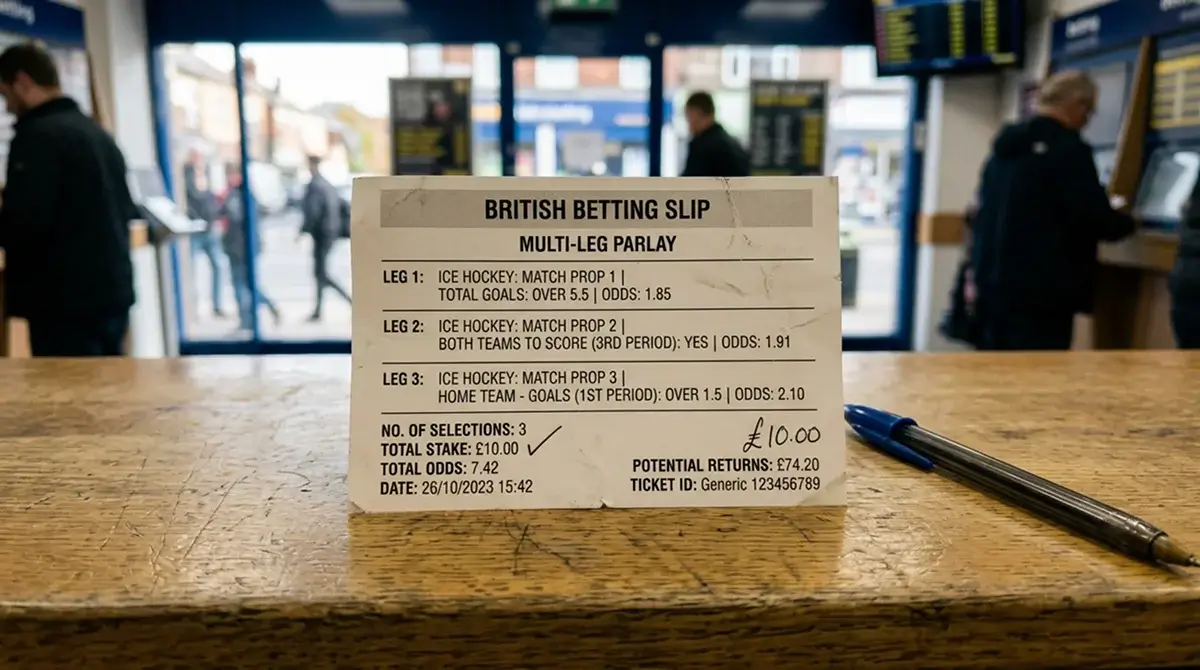
Books love multi-leg prop parlays because the juice compounds. A two-leg prop parlay at typical UK pricing carries something like 10-12% combined hold; a four-leg parlay can run 18-25% depending on the legs. That is a heavy tax to overcome, and the public happily pays it because the payouts look enormous on small stakes.
The trick to making multi-leg prop parlays work is correlation — and most UK punters do not understand how books price correlation in props. Two anytime goalscorer legs from the same team are not independent events; if Team A scores four goals, multiple skaters likely got one. Books either price the parlay as if the legs are independent (which the punter benefits from) or apply a correlation adjustment that flattens the payout.
The right approach: use prop parlays as a focused expression of a single match thesis, not as a random selection of legs. “Team A in a high-scoring win at home” can be expressed as a parlay of team total over 3.5, top-line forward to score, and starting goalie of the opposing team to record over 28.5 saves. All three legs lean the same direction, the book may or may not have correlated them efficiently, and your edge comes from finding parlays where the price treats correlated legs as independent.
Shopping props across UK books
The single most actionable habit I can give UK prop bettors: open three sportsbook apps before placing a prop ticket. Anytime goalscorer prices for the same player on the same game routinely differ by 0.50-1.00 in decimal odds across major UK operators. Saves lines differ by half-save increments with the over/under flipping at different odds. SOG lines move on the same player by a quarter-shot with juice swings of 10-15%.
The math here is brutal. A 3.20 anytime goalscorer at one book versus a 4.00 at another is the difference between a 31% implied probability and a 25% implied probability. If your true probability estimate is 30%, only one of those two prices represents a winning bet — and the other represents a guaranteed loser over enough samples.
UK punters often default to a single sportsbook out of habit, deposit limits, or promotional inertia. That inertia costs more in props than in any other market, because the price variance is highest. Even a basic two-book comparison routine — primary book plus a backup — catches enough of the worst pricing to materially improve a punter’s long-term return.

Treating props as a research market
Props are the market that most rewards research and most punishes laziness. The casual punter who taps a 9.00 longshot scorer because the player has a fun name is in a different game from the punter who has checked power-play deployment, confirmed the opposing starter, and compared prices across three books. The first is feeding the juice; the second is mining for edges that the books have not had time or volume to sharpen.
The discipline is unglamorous. Two minutes of prep per prop ticket — usage check, opposing goalie check, price comparison — beats two hours of post-loss analysis every time. That habit is what turns props from a leak into a steady contributor.
Why do anytime goalscorer prices vary so much between two UK sportsbooks for the same player?
Books use different base models, weight power-play deployment and shooting variance differently, and adjust at different speeds when news breaks. Combined with thin public volume on individual prop lines, the result is that two books pricing the same player on the same game can sit half a goal apart on probability terms. Price comparison is the single highest-value habit in this market.
How are shot-on-goal props impacted by power-play time on ice?
Power-play TOI is the strongest predictor of SOG outcomes for top-six forwards. A player on the top power-play unit gets 3-4 extra minutes per game in high-shot situations, which translates to 0.8-1.2 additional shots over the average game. When power-play deployment changes — promotion or demotion between units — the SOG line should shift accordingly, but books often lag by a game or two before adjusting.
What is the typical line for saves on a goaltender facing a top-five offence?
Against a top-five offence, the saves line typically sits at 30.5 to 32.5 depending on venue and matchup pace. The line reflects projected shot volume of roughly 33-35 shots, with the difference being the book’s implied save percentage of about 91%. Lower-quality opposition produces lines in the 24.5-27.5 range. Confirmed-starter news moves the line by 1-2 saves; backup-goalie news pushes it 2-3 saves higher to reflect the lower save efficiency.
Created by the ”ice Hockey Betting” editorial team.