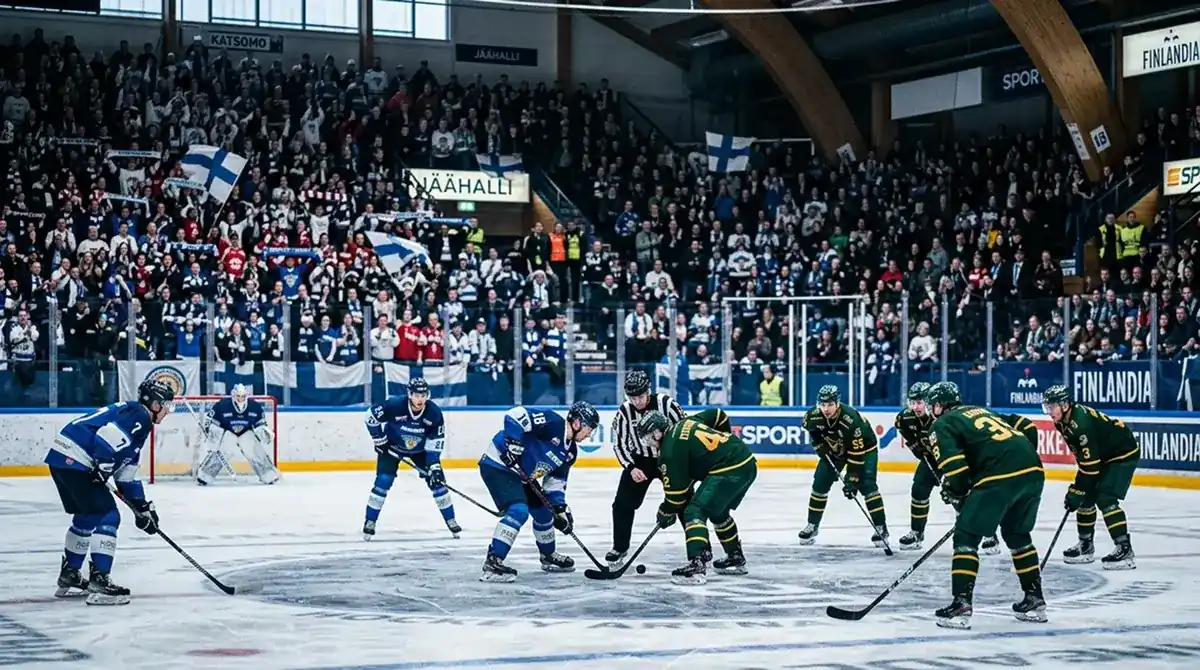
Back-to-Back NHL Games: The Schedule Edge
 Available in US

The schedule quirk hiding in plain sight
An 82-game NHL regular season packed into roughly 180 calendar days produces a brutal schedule: every team plays multiple back-to-backs across the year, and most clubs face 12-15 of them depending on the calendar. The 1,271 regular-season games across the league (32 teams playing 82 each) create endless rest-mismatch matchups that the books price, but that most UK punters do not analyse with any depth.
Back-to-back betting has been a steady contributor to my own NHL returns for nine years. The edge is not enormous — books have priced rest variables for a long time — but it persists because the public consistently underweights schedule fatigue. The casual punter sees two teams’ season records and bets accordingly. The disciplined punter checks who played last night, who is travelling, who is going to start in net, and adjusts.
This guide covers back-to-back frequency by team, the goalie rotation pattern that defines most back-to-backs, the home-versus-road split, how betting models price the rest variable, and the practical takeaways for UK punters.
Back-to-back frequency by team
The NHL distributes back-to-backs unevenly across teams. Travel-heavy West Coast clubs and small-market teams typically draw more back-to-back assignments than Northeast clubs with shorter travel obligations. Over the course of a season, the gap can reach 4-6 back-to-backs between the most and least burdened teams — a meaningful workload difference across the schedule.
The structural factors that produce more back-to-backs: distance from neighbouring teams (West Coast and Florida clubs), shared arenas that constrain home-game scheduling (the LA Kings and Clippers sharing Crypto.com Arena historically created scheduling pressure), and the league’s compressed calendar around major holidays. Teams with multiple back-to-backs against quality opposition face genuine fatigue stress, even with modern training and recovery infrastructure.
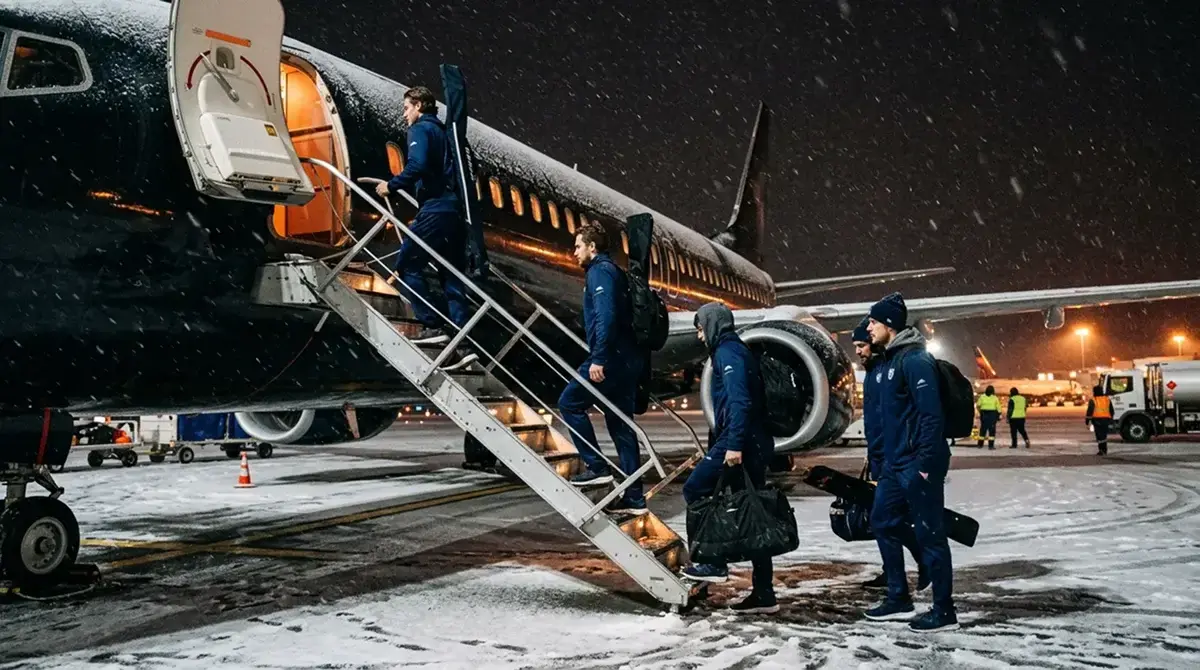
The data that matters for betting: track which teams have a back-to-back appearing in the next two days and which are rested for the same window. The rested-versus-fatigued differential is the cleanest tradable signal, and it widens when the fatigued team is also travelling between the two games.
Goalie rotation on back-to-backs
Karry Shreeve at Caesars Sportsbook quoted the 3-5% implied probability shift from a goalie change as the headline number to remember. Back-to-back nights are exactly where that shift compounds with rest fatigue. The standard NHL coaching rotation: starter plays night one, backup plays night two. The team coming into night two with their backup is statistically disadvantaged not just by the rest but by the goaltending downgrade — both effects pull the same direction.
The exceptions to the standard rotation are where the betting edge lives. A team facing two playoff-quality opponents on a back-to-back might give their starter both starts, accepting fatigue rather than the goaltending downgrade. A team in a soft stretch of the schedule might rest their starter on both nights and split between two backup-grade goalies. These rotation choices typically get confirmed in morning skate windows, and they meaningfully affect the line.
The most tradable back-to-back pattern: the fatigued team starts their backup, the rested team starts their top-tier starter, and the matchup features either travel for the fatigued team or a meaningful skill gap. Stack those factors and the rested team becomes a stronger favourite than the moneyline reflects. For the broader read on goalie news as a tradable variable, see the NHL goaltender analysis guide.

Home versus road on back-to-backs
The home-versus-road split on back-to-backs is more nuanced than the basic intuition suggests. A team playing their first game at home and their second game on the road faces a meaningful travel hit between the two games. A team playing both games at home avoids the travel but still carries the rest deficit. A team playing both games on the road compounds travel with fatigue.
The home-home back-to-back is the lightest version of the schedule problem. The team rests, eats and sleeps in familiar settings. The body clock is undisturbed. The goalie rotation is the main variable, and the moneyline impact is modest — typically 1-2% in implied probability versus a rested home team.
The road-road back-to-back is the heaviest. Travel between road cities, often with same-day flights, produces the worst-case scenario. The fatigued team in this scenario tends to underperform their season-long road numbers by 4-6% in implied win probability. Books price this aggressively, but not always fully — particularly when the matchups appear competitive on paper.

The mixed back-to-back (home then road, or road then home) sits between the two extremes. The home-then-road variant tends to be tougher on the team because they are travelling after a game played at full intensity. The road-then-home is easier because the team is returning to familiar settings for night two.
Betting models and the rest variable
Books incorporate rest as a model input but with surprising conservatism. The average NHL television audience of roughly 435,000 viewers on ESPN and TNT during the 2024/25 regular season — a number that has been declining year over year — reflects a sport where casual fan engagement is relatively low, and books design their models for the population actually betting rather than for ESPN viewership. That population skews toward more sophisticated bettors than NFL or NBA, but it still includes enough public money that rest factors get priced more carefully than fatigue alone would suggest.
The rest variable shows up most clearly in second-night totals. A fatigued team playing their second game in two nights tends to produce lower-scoring games, both because their offence is sluggish and because their backup goaltender faces a different shot quality profile than the starter would have. Totals in second-night-of-back-to-back games tend to settle 0.3-0.5 goals below the same matchup with both teams rested.
For moneyline, the rest variable adds roughly 2-4% to the rested team’s implied win probability on average, with the swing widening based on the home/road configuration and goalie rotation. Books price most of this in, but the timing window for catching pre-adjustment prices is real — particularly on Tuesday and Wednesday games where the schedule produces back-to-backs that the broader market has not focused on.
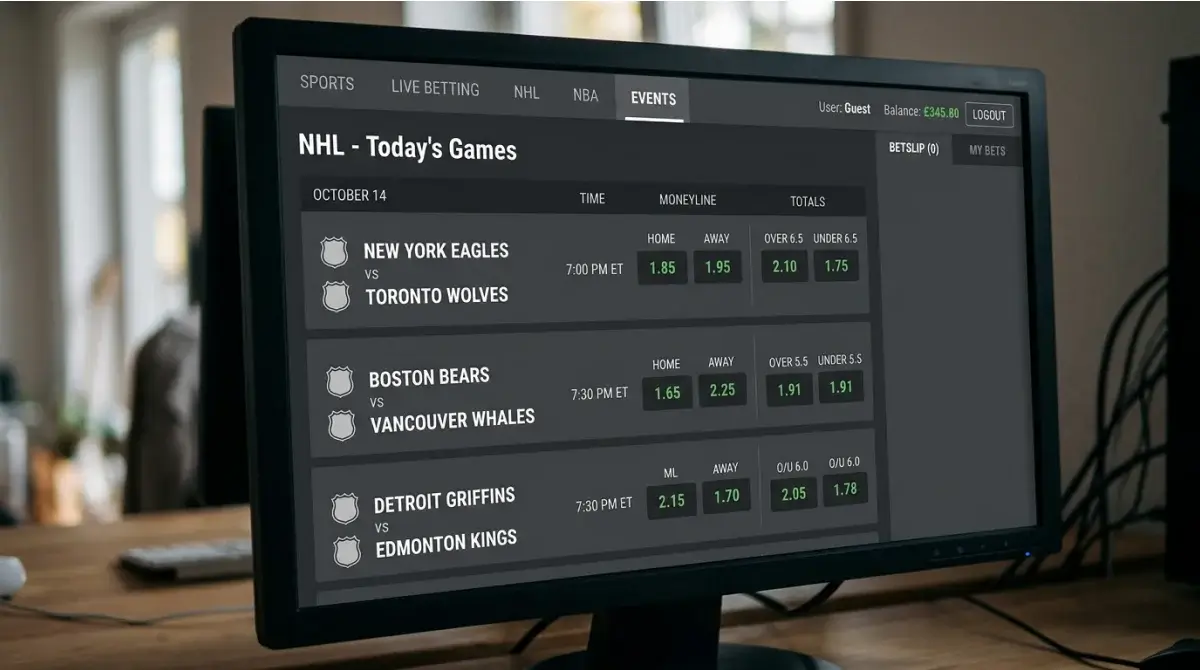
Practical takeaways for UK punters
The schedule edge is genuine but it requires consistent attention to capture. The discipline that works:
First, build a habit of checking the previous-night schedule for both teams before placing any NHL bet. The rested-versus-fatigued differential is the single most actionable schedule factor. Second, confirm the goalie rotation. The expected backup starting for the fatigued team produces the largest swing; the unexpected starter playing both nights for the fatigued team produces a smaller swing but a potential value opportunity if the books over-adjusted in expectation of the backup.
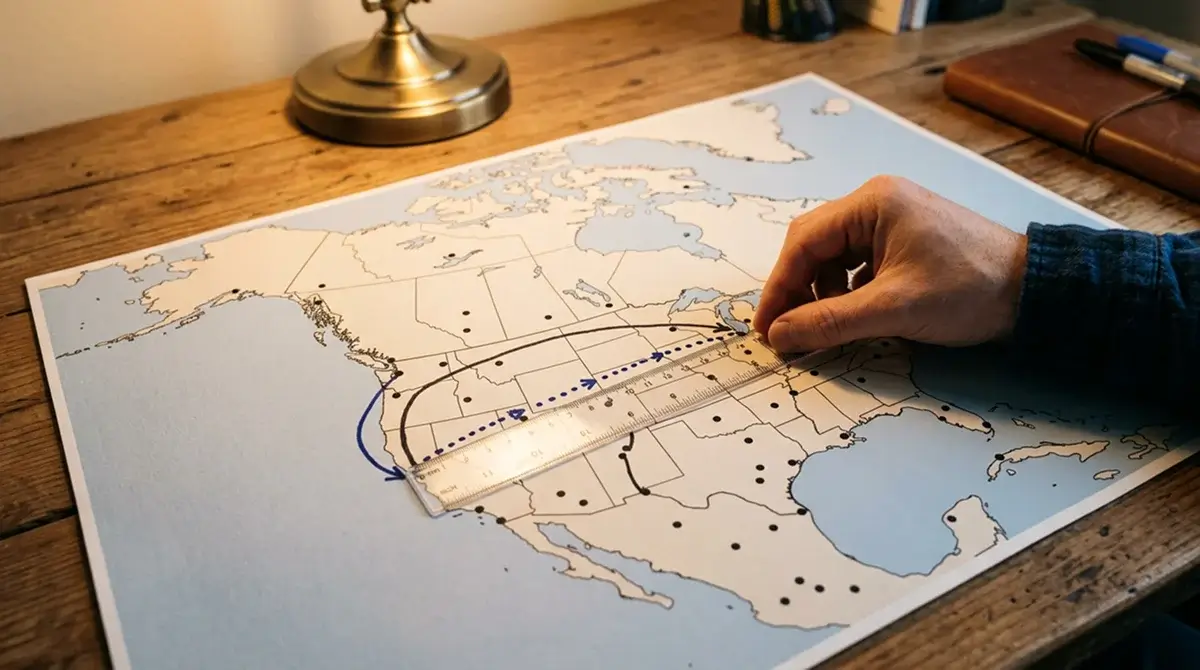
Third, factor in travel. A simple distance lookup between cities is enough to identify the matchups where fatigue is heaviest. Teams travelling more than 1,500 miles between back-to-back games typically underperform their season averages by a clear margin; teams travelling less than 500 miles see a much smaller effect.
Fourth, focus on totals rather than moneyline when the rest gap is significant. The pricing inefficiency on second-night totals is greater than on moneyline because the public bets totals less analytically and books absorb more variance through the live market.
The compounding edge of consistent attention
None of this is a single big edge. Back-to-back betting is a collection of small adjustments that compound over a long season. A 1-2% improvement in expected value across 20-30 back-to-back bets per season is not life-changing, but it is the kind of consistent contribution that turns a break-even punter into a profitable one over a full year.
The discipline is unglamorous: schedule checks before every bet, goalie rotation confirmations, travel distance lookups. Two minutes of work per ticket. The payoff is steady and quiet, and it is exactly the kind of edge that the casual punter never bothers to capture.

How big is the typical second-night moneyline shift in NHL back-to-backs?
The second-night fatigued team typically loses 2-4% of implied win probability compared to a rested matchup baseline, expanding to 4-6% when travel is heavy and the backup goaltender starts. Books price the standard back-to-back closely, but the heaviest scenarios — road-road back-to-backs with confirmed backup starts — sometimes leave a small additional edge for disciplined punters.
Does the rested team’s goaltender always start against a tired opponent?
Most of the time, yes, but not always. Coaches occasionally hold their top-tier starter for a tougher matchup later in the week, particularly if the matchup against the fatigued opponent is winnable with backup-quality goaltending. The starter-versus-backup decision for the rested team is typically confirmed in morning skate windows and is a key input to back-to-back betting decisions.
Are Western Conference back-to-backs harder to handicap than Eastern ones?
Yes, because Western Conference teams travel longer distances on average between games and face more time-zone shifts. The same back-to-back template on paper produces different fatigue outcomes for a Vancouver team flying to Dallas than for a Boston team driving to New York. The geographic spread of the Western Conference makes the rest-fatigue variable noisier, which creates both more opportunity and more risk than Eastern back-to-back betting.
Prepared by the ice Hockey Betting editorial staff.