
Home Ice Advantage in Hockey Betting
 Available in US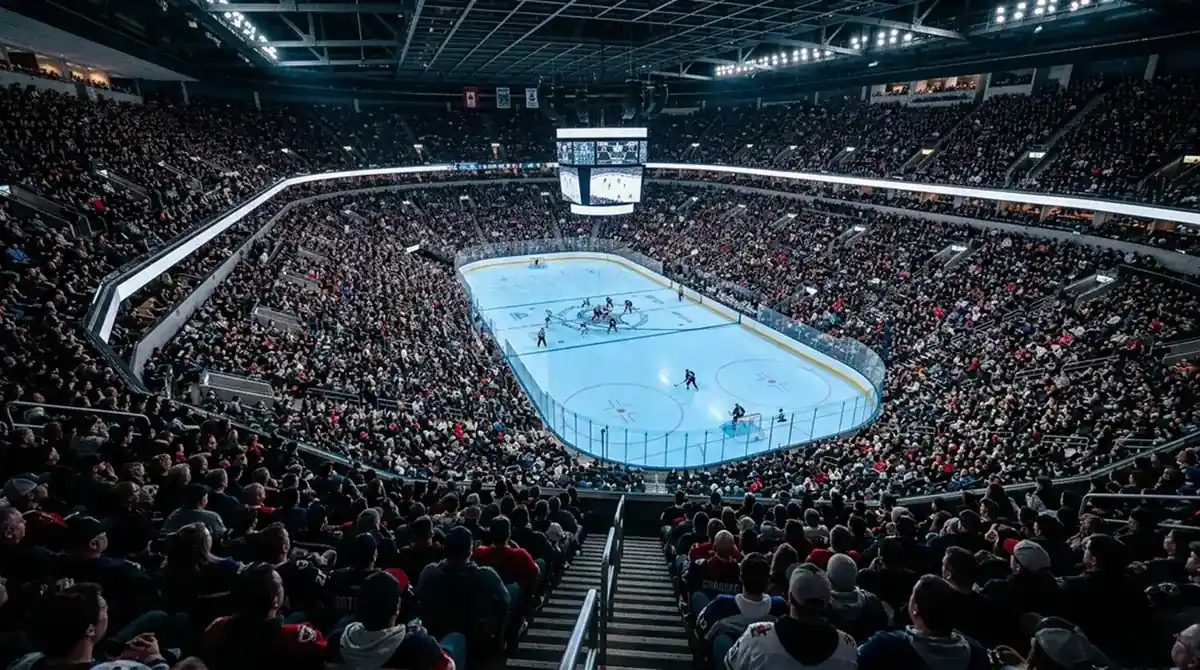
The smallest of the big advantages
Home ice advantage is the most overrated and underrated factor in hockey betting simultaneously. Casual punters overrate it — every favourite is “stronger at home” in their heads, regardless of whether the data supports it. Analytical punters underrate it — they have read enough about declining home advantage in sports generally to dismiss it as a vanishing edge. The truth sits somewhere in between, and the variation matters more than the average.
Across the 1,271 NHL regular-season games per year, home teams win something close to 53-55% of the time across recent seasons. That is meaningful — it represents 3-5 percentage points of implied probability that the books bake into every line. But the league average masks substantial team-by-team variation: some teams genuinely exploit home ice for 8-10% of additional win equity, others perform nearly the same on the road as at home. Treating home ice as a flat constant is a mistake.

This guide covers the mechanics of the last-change matchup edge, arena-specific quirks, how home record gets priced into the line, the playoff-versus-regular-season distinction and a brief look at EIHL home advantage. The EIHL added record context in 2025/26 — the league set a total attendance record of 1,321,128 spectators with an average crowd of 3,863 per match across the season — which makes home ice in British hockey both atmospherically and statistically interesting.
The last-change matchup edge
The single biggest mechanical advantage of being the home team in hockey is “last change” — the rule that the home team gets to make the final line change after a stoppage in play. This sounds technical, but it is the most exploited rule in coaching strategy. The home coach can see what line the opposing coach has put out and then deploy a specifically chosen matchup against it. Over 60 minutes of stoppages, this produces meaningful matchup advantages.
The teams that exploit last change most aggressively tend to have specialised shut-down units — a defensive forward line and a defensive defenceman pairing assigned to neutralise the opposing team’s top scoring line. Home games allow that shut-down assignment to land cleanly; road games force the coach to anticipate matchups rather than dictate them.

The implication for betting: teams with strong defensive depth and clear shut-down assignments tend to have larger home-road splits than teams that play a more uniform system across lines. A team that wins at home by 5-6% more than they win on the road often has a structural last-change advantage that should not be assumed to translate to a road game.
Arena-specific quirks
Beyond last change, individual arenas produce subtle but real effects on play. Boston’s TD Garden is one of the tighter rinks in the league — slightly shorter than the standard 200 feet, with corners that produce different rebound angles than most rinks. Florida’s BB&T Center has historically had softer ice in spring playoff conditions, slowing the game and benefiting defensively structured teams. Anaheim’s ice has run faster than the league average for years.

These arena effects show up in scoring environments as much as in win rates. A team that plays well at home might do so partly because their arena’s ice conditions suit their style, not just because they sleep in their own beds. The result is that home-ice advantage compounds with arena-specific style fit, and the combined effect is larger than either factor in isolation.
For UK punters, the practical takeaway is to keep a small file of venue-adjusted scoring environments alongside team performance data. Over multiple seasons, the consistent over- or under-performance of certain venues becomes a useful adjustment to pre-match totals projections.
Home record in pricing
Books incorporate home record into the moneyline, but with a calibrated rather than literal approach. A team that has gone 18-3 at home in a given season is not priced as if their true home win rate is 86%; the book regresses that record toward the long-run home-team average of 53-55%. The implied probability uplift for the home team typically lands at 3-5% in straightforward matchups.
The exceptions are where teams have demonstrated structural home-road splits over multiple seasons. Teams that consistently win 60-65% of home games and 45-50% of road games carry a home premium that books price higher than the league average. The most extreme cases produce moneyline gaps of 8-10% implied probability between home and road versions of the same matchup.
The 2023/24 playoff data illustrates the home-ice dimension at the most extreme. Total NHL playoff attendance for that postseason exceeded 1.62 million spectators across the bracket, with the Florida Panthers winning their first Stanley Cup in franchise history. The Panthers’ playoff run featured a strong home-road split, particularly at home in the BB&T Center where their physical style and ice conditions combined effectively. The home record in that run was a meaningful factor in series pricing.

Playoffs against regular season
The home advantage that exists in the regular season grows in the playoffs. The mechanism is partly atmospheric (playoff crowds are louder and more partisan) and partly strategic (last change matters more in tight series where matchup discipline becomes critical). Game 7 in particular has historically favoured the home team by a wider margin than regular-season home games — the implied probability uplift is closer to 7-10% than to the regular-season 3-5%.

The implication for series betting: bracket structures that give a stronger team home ice for Game 1 and Game 7 carry meaningful additional equity beyond the team-quality difference. A series priced at 1.65 for the higher seed in a 1-vs-8 matchup might warrant 1.55 once the home-ice scheduling advantage is fully factored in.
The 1,271 regular-season games provide a long runway to identify which teams genuinely lift their home performance in playoffs as opposed to which carry their regular-season form across both environments. The distinction matters for futures markets that price playoff success rather than regular-season finishes.
EIHL home advantage snapshot
The Elite Ice Hockey League produces home advantage on a different scale to the NHL but the principle is the same. EIHL teams playing in their home arenas — the SSE Arena in Belfast, the Sheffield Arena, the GMB Arena in Cardiff and others — benefit from familiar ice, partisan crowds and home-team scheduling. The league’s 2025/26 attendance record of 1,321,128 across 270 regular-season games meant the average match drew 3,863 spectators, with half of the 10 clubs averaging above 3,000.
The British arenas tend to be more intimate than NHL venues, which amplifies crowd effects. Penalty calls, momentum swings, and goaltender focus all shift slightly in favour of the home side compared to neutral conditions. UK punters betting EIHL should treat home advantage as a slightly larger factor than NHL home advantage, probably 5-7% of implied probability rather than 3-5%.

The other EIHL-specific consideration is the venue-style fit. Different arenas play differently — the larger Sheffield Arena produces a more open game than the smaller Cardiff venue, which suppresses transition opportunities. Bettors who track these venue effects across an EIHL season build small but real edges that the books are slower to price than they are in NHL coverage. For a deeper read on the league’s structure and betting markets, see the EIHL betting guide.
The right weighting
Home ice advantage is real, variable, and often mispriced. The discipline that captures the edge: treat home record as one input among several, regress extreme splits toward the league average, and lean into the wider playoff version of the same factor. The casual punter who assumes home ice is a binary advantage will overpay for some home favourites; the analytical punter who dismisses it entirely will underprice some home-team matchups. The honest middle position — home ice as a calibrated 3-5% uplift in the regular season, larger in playoffs, larger again in EIHL — is the framework that produces consistent results across a season of bets.
How many percentage points of moneyline equity does NHL home ice typically buy?
The league-average home team wins 53-55% of regular-season games, which translates to roughly 3-5% of implied probability uplift compared to the same matchup on neutral ice. Teams with structural home-road splits — typically driven by last-change exploitation or arena-specific style fit — can carry uplifts of 7-10% in extreme cases. The book prices this calibrated to historical pattern rather than to single-season records, which can leave small value pockets when teams shift their underlying home-road profiles.
Why does home ice matter more in Game 7 than in Game 1 of a playoff series?
Game 7 atmosphere is louder, crowds are more partisan, and matchup discipline becomes critical at the tightest stakes of the season. The home team in Game 7 gets last change in a game where every shift matters, against an opponent who has been on the road for multiple games and is dealing with travel fatigue. The combined effect pushes home-ice uplift closer to 7-10% in Game 7 compared to 3-5% in regular-season games.
Is EIHL home advantage larger than NHL’s by virtue of smaller-rink familiarity?
Yes, slightly. EIHL arenas are more intimate than NHL venues, the crowds are closer to the action, and the venue-style fit varies more across the British circuit because the rinks themselves have more individual character. The combined effect produces a typical EIHL home-ice uplift of 5-7% versus NHL’s 3-5%, with substantial variation by team and venue. UK punters should not assume the gap is huge, but they should expect EIHL home ice to be modestly more impactful than NHL home ice on average.
Published by the ice Hockey Betting team.